CapitalTrend + Alterpath
The AI financial intelligence layer for the SAP enterprise.
Starting with finance. Built to analyze every process in SAP.
The problem
Every entity runs its own instance, its own chart of accounts, its own way of naming a customer. So the consolidated picture gets rebuilt by hand every quarter. It takes weeks, and by the time it is finished nobody fully trusts it.
“By the time my controller has stitched it together by hand, the quarter is closed — and the number is already old.”
— the operating reality in most multi-entity groups
No shared key
Nothing in the landscape carries a group-wide identifier. Not one column, in any system.
Parallel charts
Every entity keeps its own chart of accounts, and none of them maps cleanly to another.
Manual close
The consolidated picture is rebuilt by hand every close. It is already old when it lands.
Split identity
One customer carries a different code in every system it appears in, so exposure never sums.
How it works
No data warehouse. No migration. Nothing is taken away from the teams already producing intelligence locally. Vinci adds the layer that puts it together.
An agent reads each entity’s extracts: the general ledger, AP and AR aging, standard cost, sales orders. It works out what the columns mean on its own, whatever the system and whatever the language.
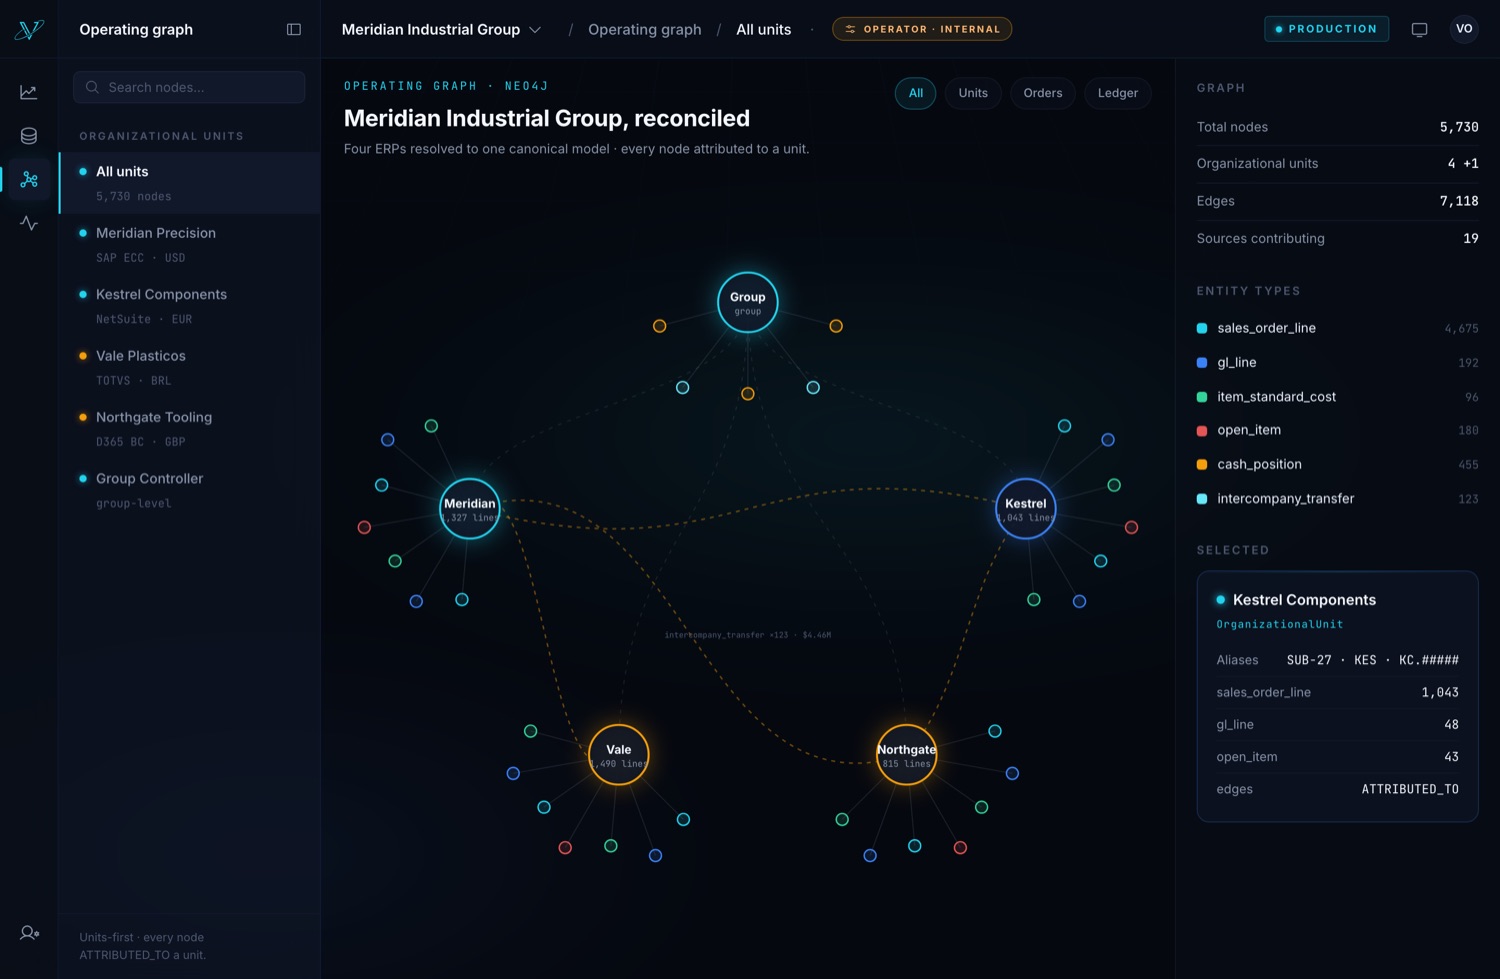
The same entity, the same account and the same customer, named differently in every system, resolved into one canonical model, with provenance back to the row each value came from.
Reviews publish executive briefs, board packs and auditable evidence. They run on a cadence and are monitored over time, with our analysts in the loop before anything reaches you.
EVERY FIGURE TRACES BACK TO ITS SOURCE ROW
The hard part
The difficulty was never the chart. It is that nothing in your landscape shares a key. Until that is solved, every consolidated number is an estimate someone assembled by hand.
Canonical account
Purchased materials
One category. Four source codes. Provenance retained on every row.
Entity binding
Each entity’s extracts land in their own channel, so the source of every row is never in question.
Account resolution
Different codes across different charts of accounts, mapped to one category that means the same thing everywhere.
Customer resolution
The same buyer under two codes and two legal names, resolved into one credit exposure instead of two partial ones.
What you receive
A Review captures a question about your business, runs against the reconciled graph, and returns the findings with the artifacts behind them. Then it keeps running.
The difference is what lands on your desk. You get an executive answer, with the evidence and the lineage attached, instead of a dashboard to interpret.
The portal
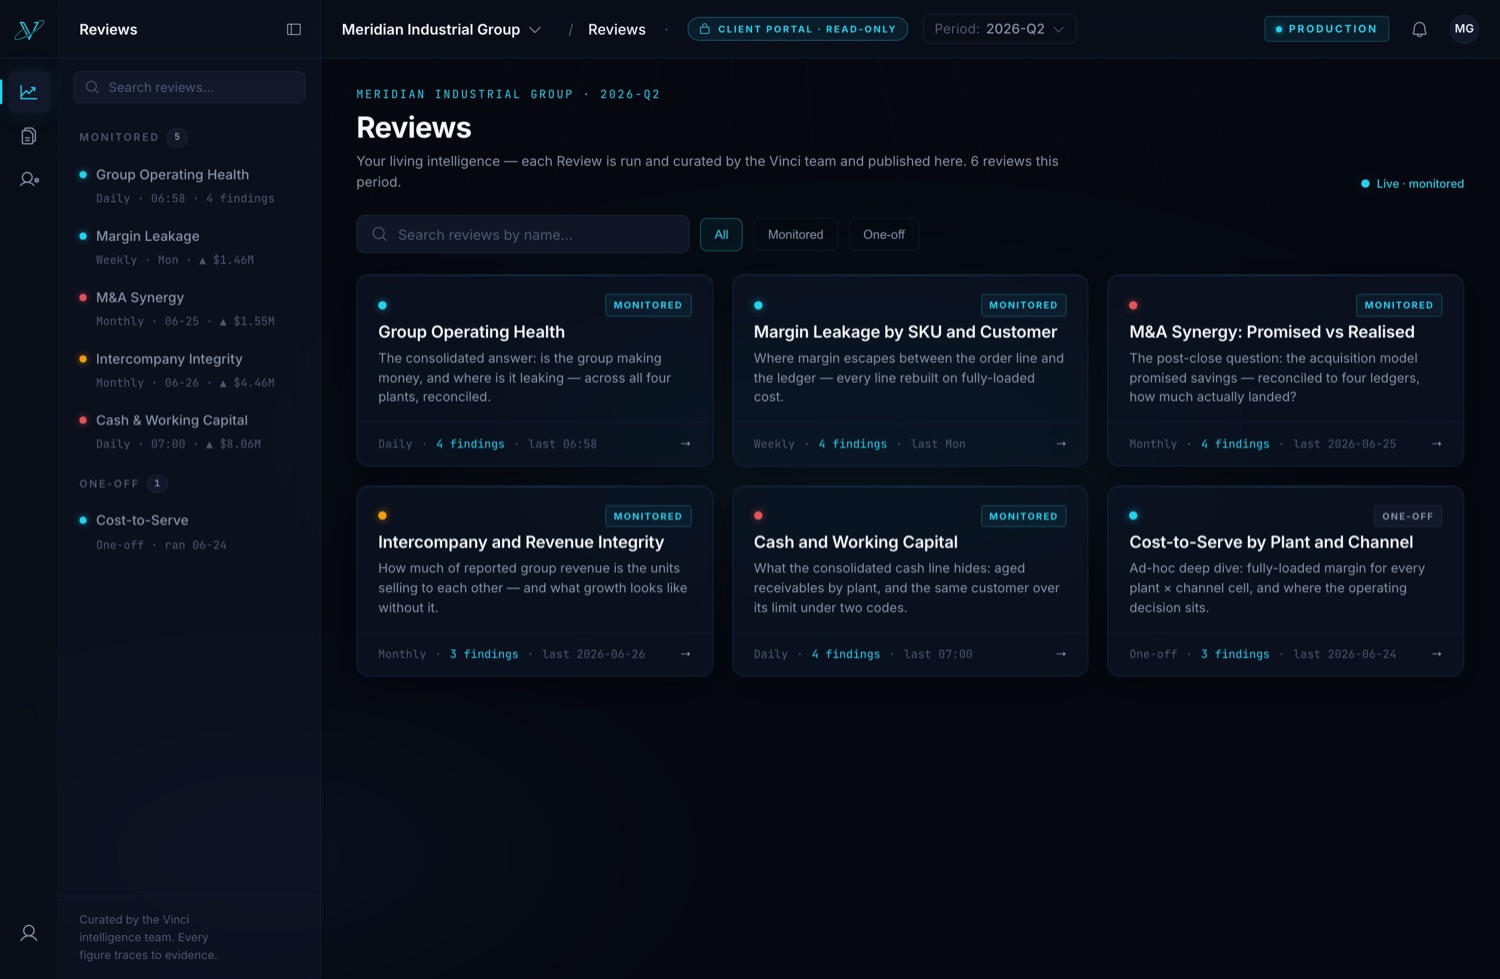
Every Review lands in a portal your finance team can read without us in the room. The consolidated answer sits at the top, the numbers behind it underneath, and the evidence one click away.
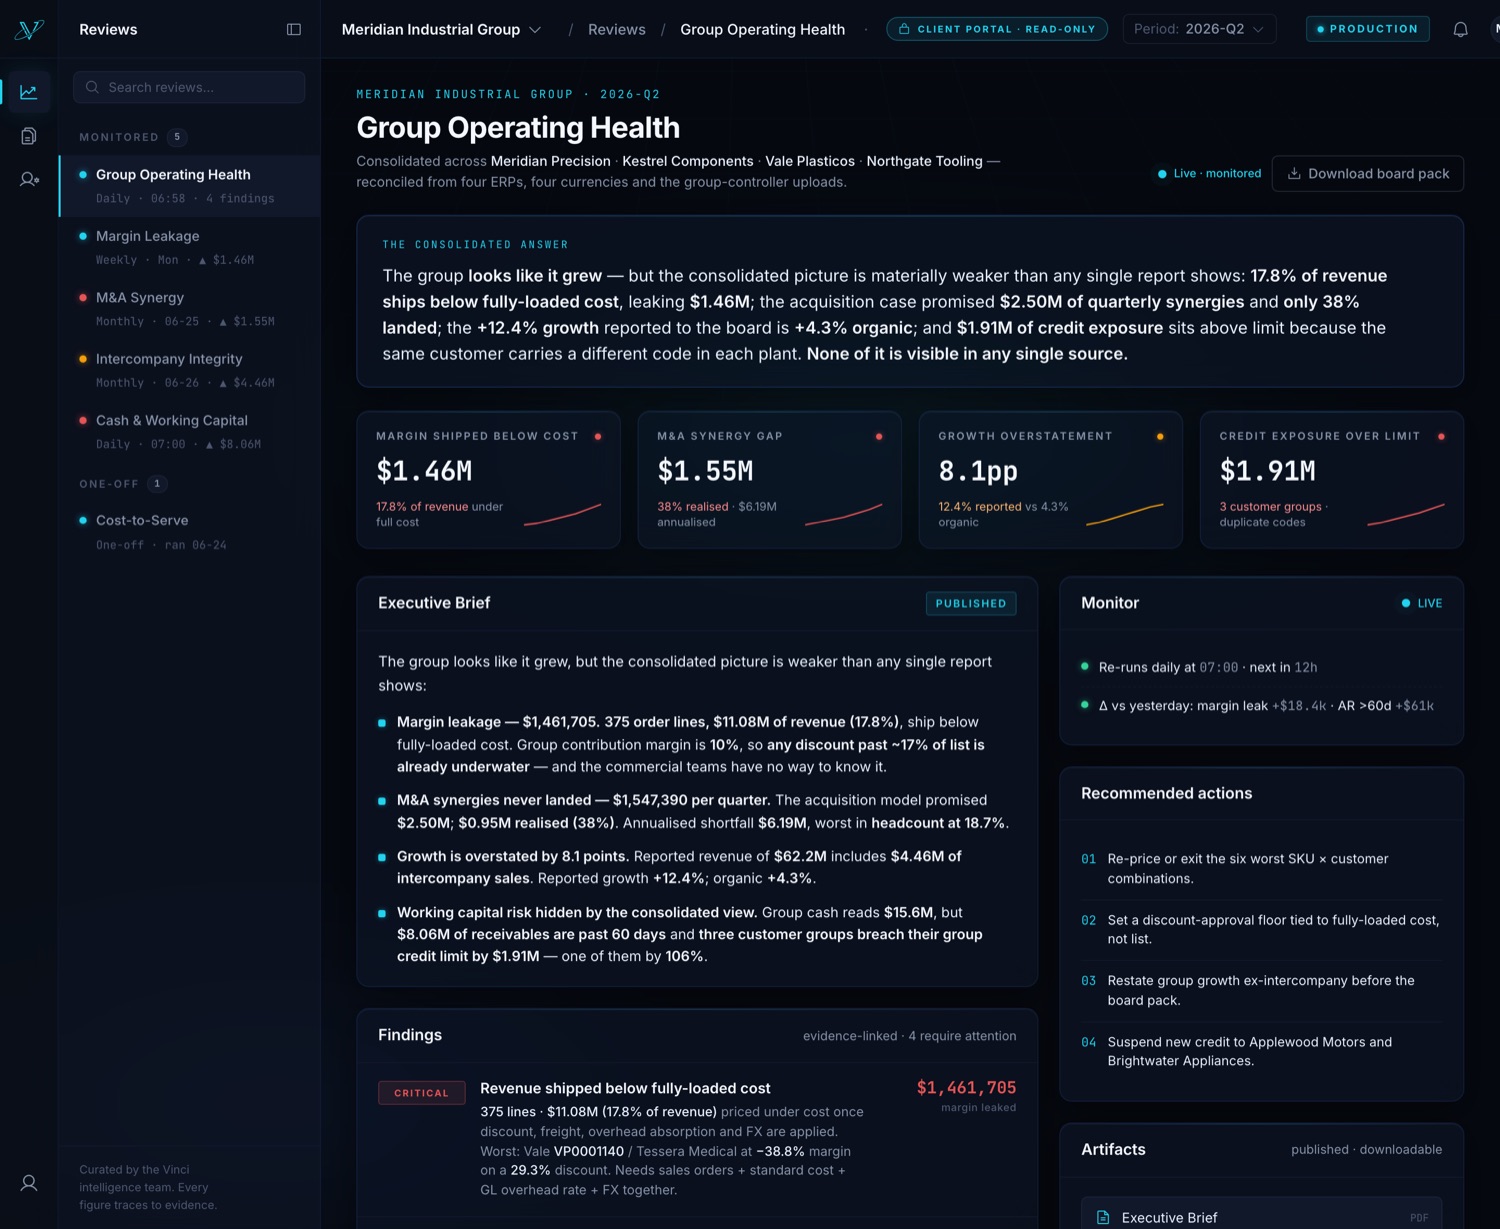
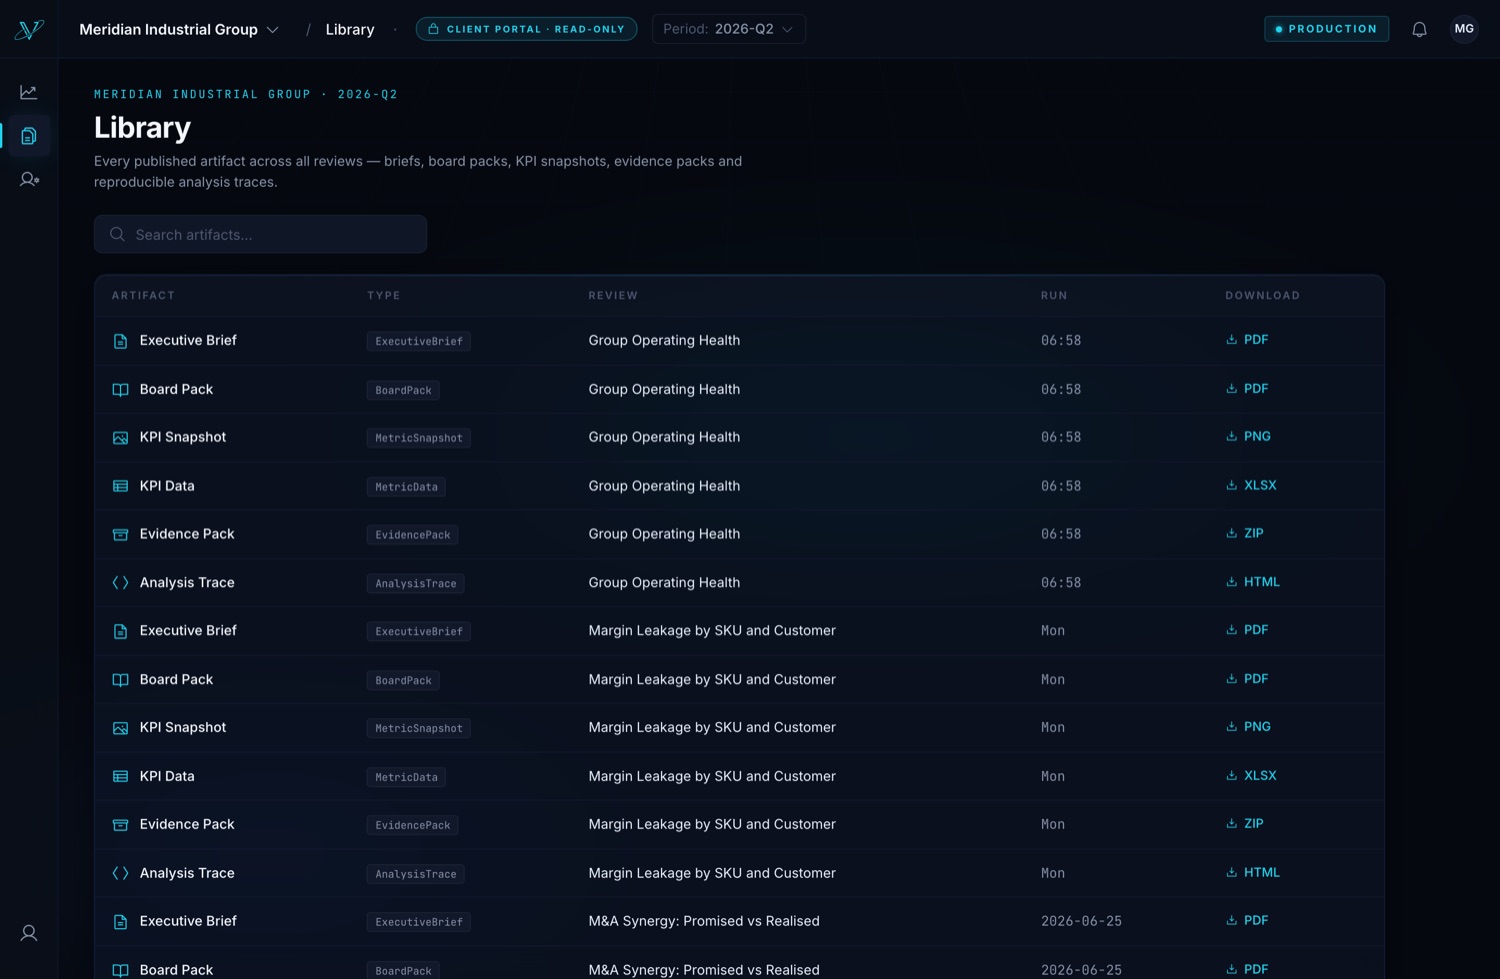
These are real screens from the product, running on a synthetic demo dataset. The group and its four units are invented, and no client data appears anywhere in them.
Proof, not assertion
Traditional advisory delivers recommendations. Every finding here arrives with its proof of work attached: an evidence pack of your own reconciled source rows, and the analysis trace that produced the number. Your controller can re-run it.
Illustrative trace, generated on synthetic data to show the shape of the output. On your landscape, these are your rows and your figures.
What Reviews surface
Each of these is invisible inside any one instance, and tedious to impossible by hand. All four come from the same run, on the same reconciled graph.
Margin leakage
17.8%
Revenue shipping below cost
Order lines priced under fully-loaded cost. No system states margin, so the commercial teams have no way to see it.
M&A synergy
38%
Of promised synergies landed
Unaskable as a question until several charts of accounts were mapped to one category.
Double counting
8.1pp
Of reported growth was internal
Units selling to each other. Nothing in the source data marks a sale as intercompany.
Working capital
106%
Over a group credit limit
Group cash reads healthy while a single buyer breaches its limit under two different codes.
Illustrative, generated on synthetic data to show what the analysis is capable of surfacing. Your figures come from your own systems.
Enterprise readiness
Financial data does not leave your control as a condition of being analyzed. The architecture assumes your CIO will ask, and answers first.
Tenant memory is architected to live in your own cloud account where required. The default is a dedicated, isolated environment under our management, with full data-residency controls.
Built on AWS Bedrock, which retains nothing by design. Not for training. Not for anything.
Customer-managed keys, end-to-end encryption and audit logs across the pipeline. Aligned to SOC 2 controls.
Delivered as a Solution-as-a-Service — never licensed. You are not buying an installation and a seat count to administer. You are subscribing to an outcome: the Reviews keep running, the graph stays reconciled, and the team behind it reports to your CFO.
The other way in
We work inside SAP. That is why our intelligence understands it.
The same house delivers functional architecture and integration inside your landscape, remote and senior, accountable for the outcome.
Get in touch
Every engagement begins the same way: we map your landscape, agree the questions worth answering, and put the first Reviews in front of you. Everything after that follows from what the data says.